
Number of Connections:
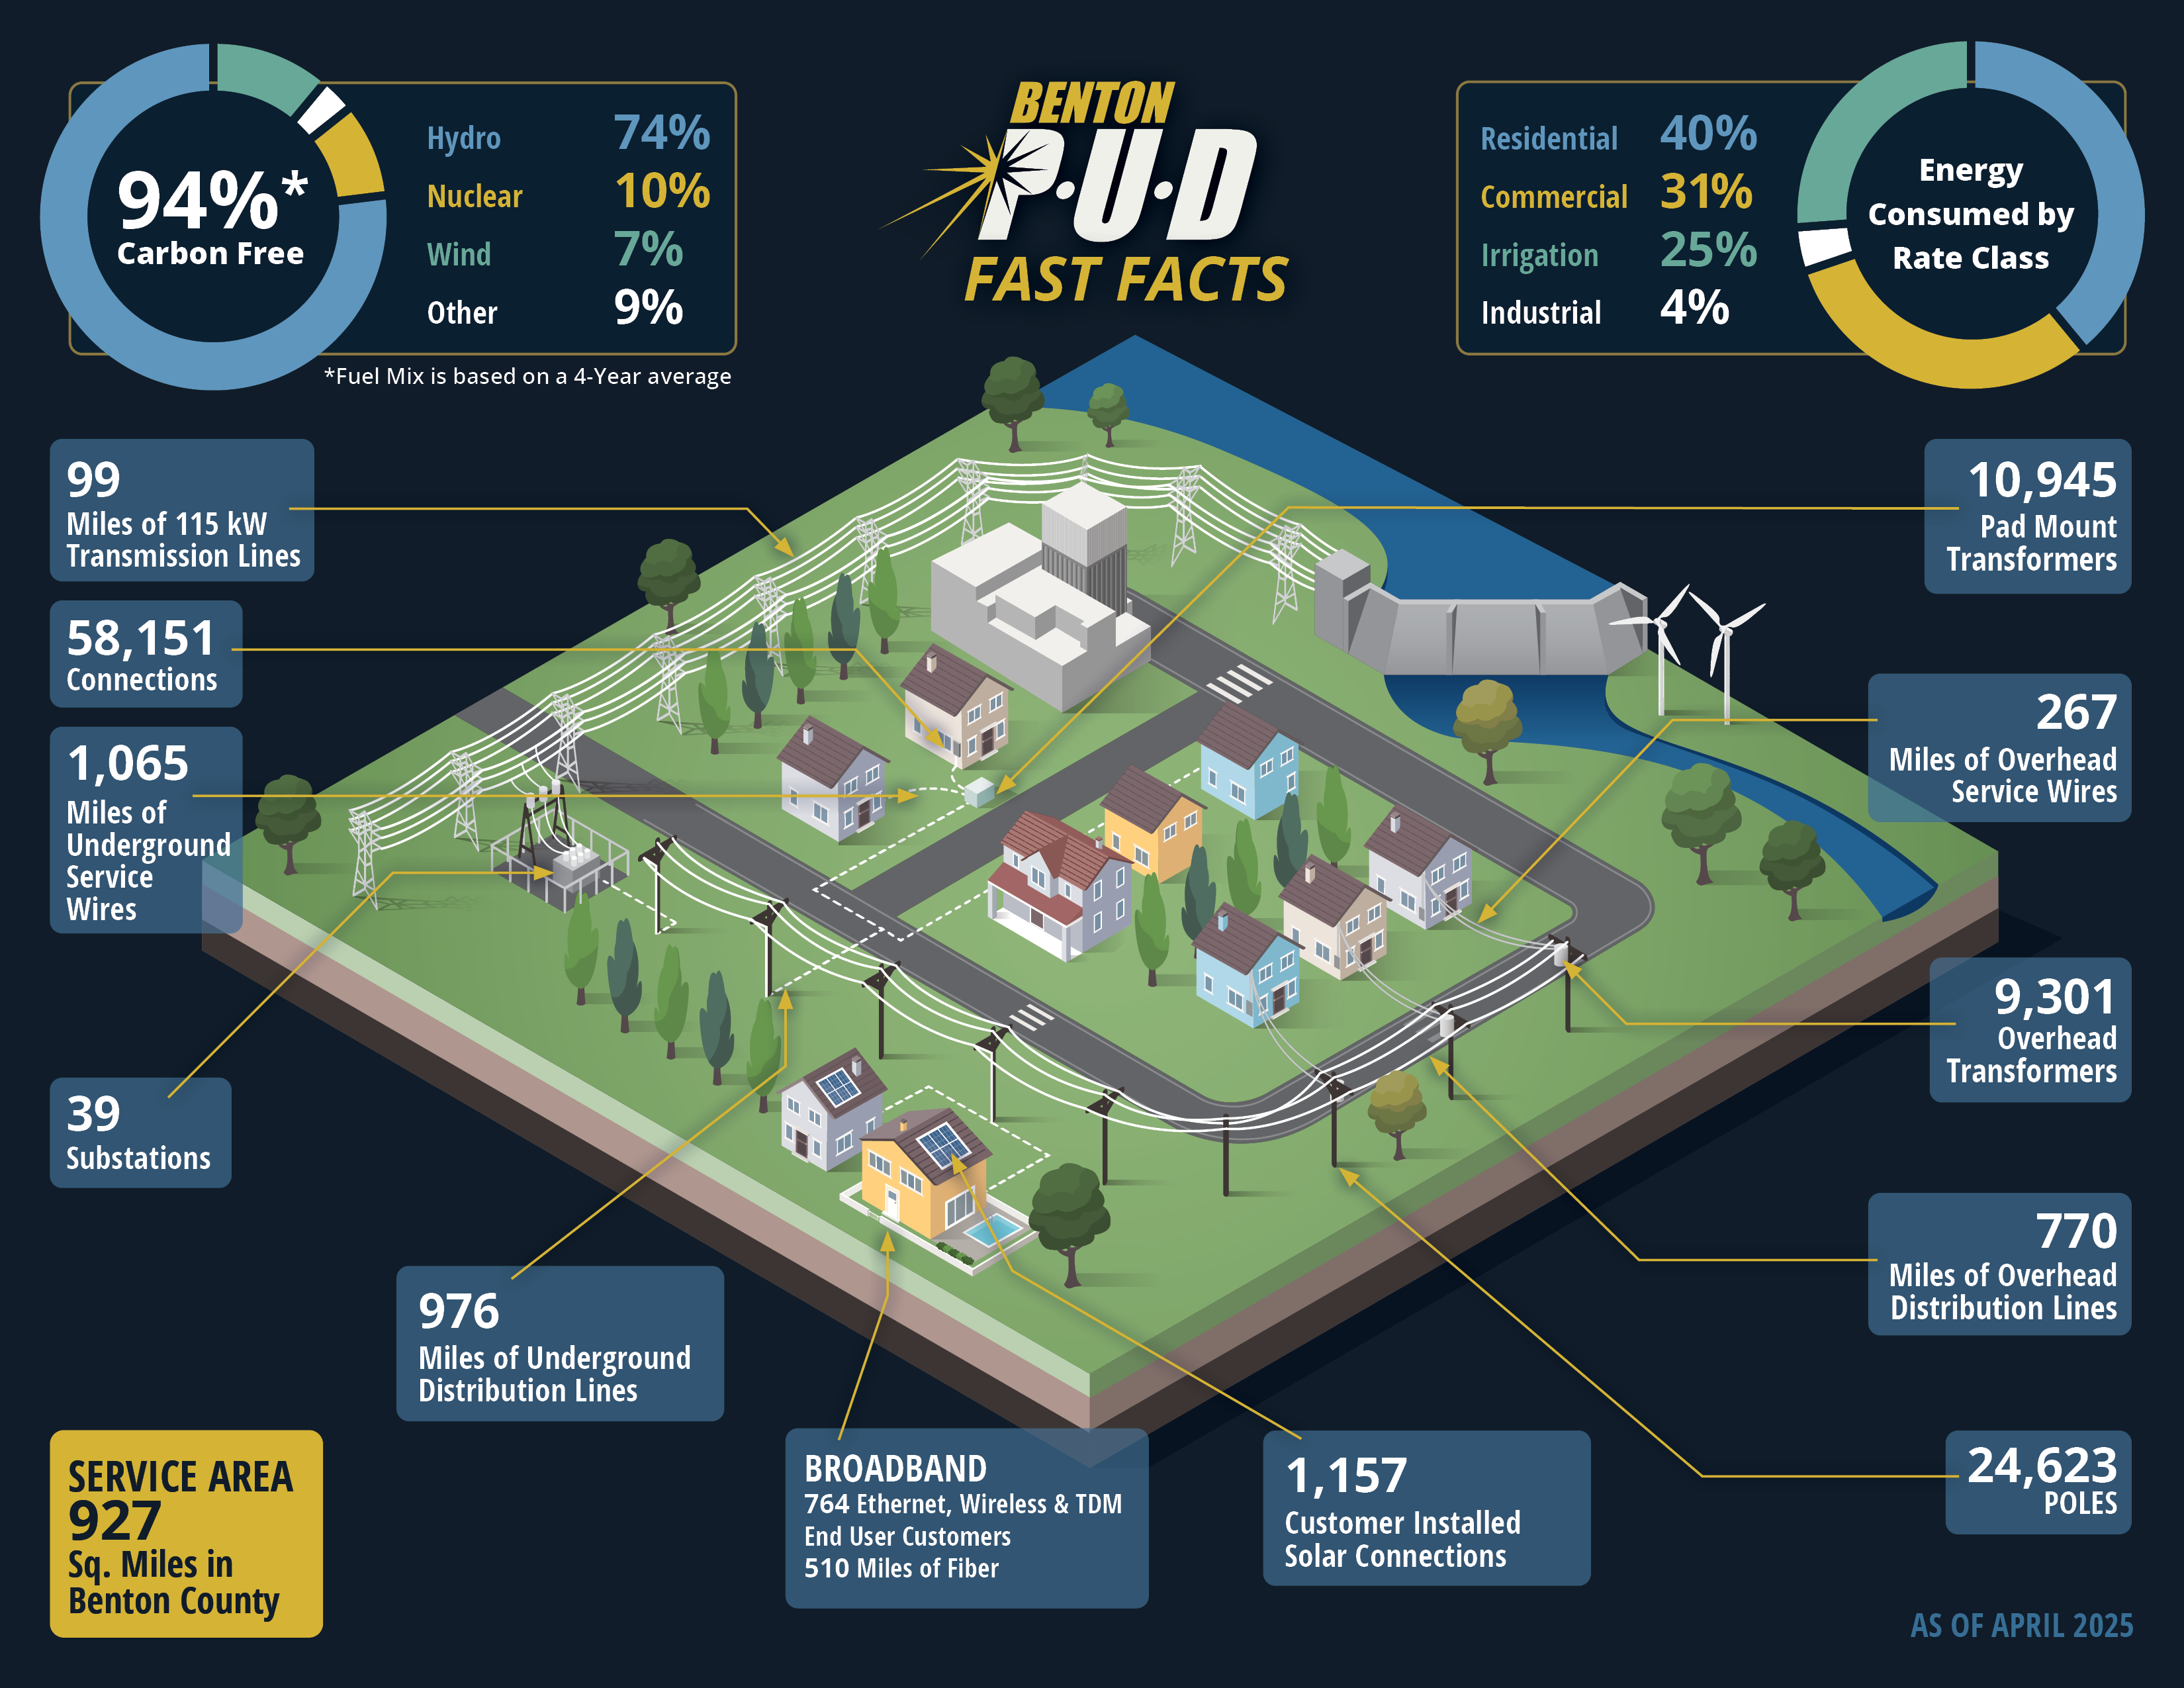
58,151
Average Monthly Residential Bill:
$115 (Note: Lower than 2/3 of comparable NW utilities)
Average Monthly Residential Usage:
1,264 kWh
Low-Income Assistance Programs:
- Low-income discounts (senior, disabled, and veteran):
$598,591 - funding was built into rates - Low-income conservation assistance:
$616,090 - funding was built into rates - Round Up for Helping Hands:
$63,456 - customer donations
| Resource | Load Served (aMW) |
|---|---|
| BPA | 211.2 |
| Packwood Hydro | 1.0 |
| Total Wholesale Load | 212.2 |
| Distribution Losses (estimated) | -6.3 |
| Total Retail Load Billed | 205.9 |
Fuel Mix (per WA Department of Commerce reporting):
| Fuel Mix | 2024 Estimate | 2020-2023 Average |
|---|---|---|
| Biogas | 0.0% | 1.7% |
| Biomass | 0.0% | 1.7% |
| Hydro | 83.1% | 73.5% |
| Natural Gas | 0.0% | 0.1% |
| Nuclear | 11.1% | 9.6% |
| Wind | 0.0% | 7.1% |
| Unspecified Source | 5.8% | 6.3% |
| Total | 100% | 100% |
| Total Carbon Free | 94% | 94% |
Energy Consumed by Rate Class:
Residential: 40.5%
General Service: 30.9%
Large Industrial: 3.6%
Irrigation: 24.7%
Other: 0.3%
General Service: 30.9%
Large Industrial: 3.6%
Irrigation: 24.7%
Other: 0.3%
Investment (Gross) in Renewable Resources:
$4.8 million; funding built into rates, includes investment in non-hydro renewable resources
Investment in conservation:
$2.0 million; funding built into rates, net of BPA reimbursement
Solar Connections:
Ely Community Solar: 75 kW capacity; 112 customers
OIE Community Solar: 25 kW capacity; 42 customers
Customer Installed Solar (AC): 9,754 kW capacity; 1,157 customers
OIE Community Solar: 25 kW capacity; 42 customers
Customer Installed Solar (AC): 9,754 kW capacity; 1,157 customers
Service Territory:
927 sq. miles in Benton County
Miles of Lines:
99 miles of transmission lines
1,746 miles of distribution lines: 770 overhead & 976 underground
1,332 miles of service wire: 267 overhead & 1,065 underground
1,746 miles of distribution lines: 770 overhead & 976 underground
1,332 miles of service wire: 267 overhead & 1,065 underground
Equipment:
39 substations
56 substation transformers
20,246 line transformers: 9,301 overhead & 10,945 underground
56 substation transformers
20,246 line transformers: 9,301 overhead & 10,945 underground
System Load:
- Annual System Peak Loads:
Summer - 438 MW (July 2024) | Winter - 393 MW (January 2024) - Record System Peak Loads:
Summer - 490 MW (June 2021) | Winter - 393 MW (January 2024)
2024 Financial Results:
- Operating Revenues: $151.9 million
- Retail Revenues: $138.3 million
- Gross Power Supply Costs: $87.5 million
- Net Power Supply Costs: $78.9 million
- Gross Capital Costs: $32.7 million
- Net Capital Costs: $30.5 million
2024 Taxes:
- Total Taxes: $14.5 million
- State Privilege Tax: $2.8 million
- State Public Utility Tax: $5.3 million
- City Tax: $6.2 million
Fiber & Fixed Wireless Customers:
764
Retail Services Providers:
12
Miles of Fiber:
510
Annual Revenues:
$2.9 million
Employees:
152 Full-Time Employees (FTEs)
Commissioners:
District 1 - Lori Sanders: First term began in January 2005
District 2 - Jeff Hall: Appointed in January 2002 and first term began in January 2003
District 3 - Barry Bush: First term began in January 2013, term ended December 31, 2024 (Mike Massey: First term began in January 2025)
District 2 - Jeff Hall: Appointed in January 2002 and first term began in January 2003
District 3 - Barry Bush: First term began in January 2013, term ended December 31, 2024 (Mike Massey: First term began in January 2025)